Inventory Growth and Market Balance
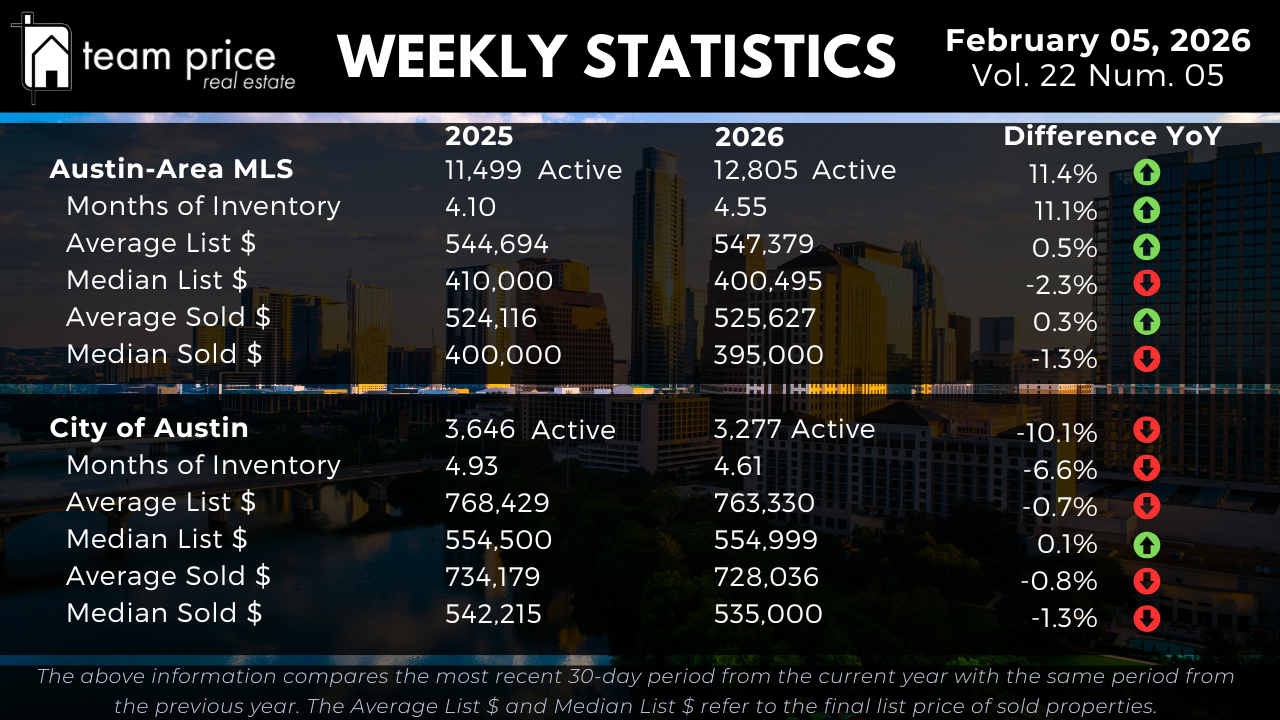
Active residential listings across the Austin-Area MLS now total 12,805, up from 11,499 at the same point last year, representing an 11.4% year-over-year increase in available supply. Inventory has continued to build as new listings enter the market faster than homes are being absorbed through sales. Based on current transaction volume, Months of Inventory stands at 4.55, up from 4.10 last year, an 11.1% increase and roughly a 1.1x expansion in supply relative to demand. Week over week, inventory levels remain elevated, confirming that absorption has not accelerated enough to materially offset new supply entering the market.
Inside the City of Austin, inventory trends remain more constrained but no longer tightening. Active listings declined from 3,646 last year to 3,277 today, down 10.1% year over year. Despite fewer listings, Months of Inventory decreased only modestly from 4.93 to 4.61, down 6.6% YoY. This indicates that sales activity has softened alongside supply, rather than demand materially strengthening. Homes are still taking longer to sell compared to historical norms, signaling reduced sales velocity rather than true scarcity.
Pricing Stability Across the MLS
Pricing across the Austin-Area MLS continues to show a clear separation between average and median measures. The average active list price increased slightly from $544,694 last year to $547,379, a 0.5% year-over-year gain. This stability reflects ongoing support at higher price points and replacement-cost inventory. In contrast, the median active list price declined from $410,000 to $400,495, down 2.3% YoY, indicating continued pressure on the middle of the market where affordability constraints remain most pronounced.
On the sales side, the average sold price edged higher from $524,116 to $525,627, a 0.3% year-over-year increase. The median sold price declined from $400,000 to $395,000, down 1.3% YoY. Week over week, both median list and sold prices have shown limited movement, reinforcing that pricing momentum remains subdued. The data continues to suggest that higher-priced transactions are supporting averages, while typical transactions remain under gradual adjustment.
Pricing Trends in the City of Austin
Within the City of Austin, pricing trends reflect a more mature phase of correction. The average active list price declined from $768,429 to $763,330, down 0.7% year over year. The median active list price was essentially flat, rising marginally from $554,500 to $554,999. This stability at the median level suggests sellers are testing price resistance rather than pushing prices higher.
Closed-sale data shows continued softening. The average sold price declined from $734,179 to $728,036, down 0.8% YoY, while the median sold price fell from $542,215 to $535,000, down 1.3%. Week over week, median pricing remains under pressure, indicating that price discovery is still underway, particularly for mid-range homes where buyer sensitivity is highest.
Negotiation and Buyer Leverage
Negotiation remains a defining feature of the Austin housing market. So far this month, 70.08% of all closed sales across the Austin-Area MLS sold below list price, essentially unchanged from last month’s 70.17%. An additional 22.05% sold at list price, up from 20.45% last month, while just 7.87% sold above list price, down from 9.38% last month and well below February 2025 levels of 12.08%. The average sold-to-list price ratio currently stands at 96.85%, confirming that price concessions and negotiated outcomes remain common across most segments of the market.
Regional and ZIP Code Variations
Market performance continues to vary widely across Central Texas. Of the 30 cities tracked, 9 recorded month-over-month price increases while 11 experienced declines, with the remainder holding relatively flat. Year over year, only 8 cities posted price increases, while 22 recorded declines. No cities are currently trading above their peak prices from the past 12 months, with all 30 remaining below recent highs.
At the ZIP code level, dispersion remains pronounced. Among the 75 ZIP codes tracked, 22 recorded month-over-month price increases while 24 declined. Year over year, 32 ZIP codes showed price increases and 43 declined. Only 1 ZIP code is currently above its peak price from the past 12 months, while 74 remain below peak levels, underscoring how widespread the reset has been across the region.
Prices Relative to Peak Levels
Prices across the Austin-Area MLS remain materially below prior market highs. The average list price is down approximately 7.5% from its March 2023 peak, while the median list price is down roughly 23.3% from its May 2022 high. The average sold price is down about 23.5% from peak, and the median sold price is down approximately 25.7%. On a price-per-square-foot basis, average and median sold values remain roughly 21% to 30% below their 2022 highs, confirming that valuation adjustments remain firmly in place.
Within the City of Austin, peak-to-current declines remain significant. The median list price is down approximately 13.5% from its May 2022 high, while the average sold price is down roughly 22.6% from peak. The median sold price has declined by more than 26% from its 2022 high. Price-per-square-foot metrics remain between 27% and 38% below peak levels, reinforcing that urban pricing has undergone a deeper correction than many suburban markets.
Market Outlook
As January 2026 progresses, the Austin housing market continues to operate in a slower, more measured environment. Inventory across the Austin-Area MLS remains higher than last year, Months of Inventory has expanded, and most homes are still selling below list price. Average pricing remains supported by higher-end transactions, while median prices show limited momentum, particularly within the City of Austin. Market conditions continue to favor patience, negotiation, and realistic pricing strategies rather than broad-based appreciation.